The Bioinformatics group consists of data analysts, software engineers, and computational biologists who have developed analytical pipelines to manage, store, annotate, and report on data produced by the Illumina sequencing platforms. We employ a combination of vendor, third-party, and in-house tools and databases to provide data-quality metrics, integrated candidate reports, and relevant biological and clinical context for experimental platform data.
The Bioinformatics team can provide help in:
- Experimental design
- Custom bait set design
- DNA sequence analysis including:
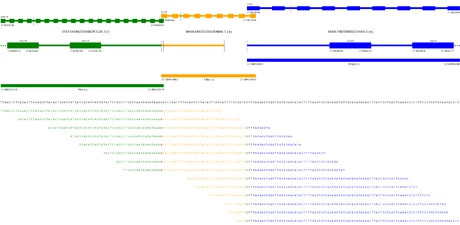
- Variant detection (SNV, Indel, CNV, and structural variants) and annotation
- SNP-based sample fingerprinting
- 10X Genomics data analysis:
- Single-cell and single-nuclei (sc/sn) Gene expression (GEx)
- Flex GEx (Fixed RNA Profiling)
- Multiome (scATAC + GEx)
- V(D)J T-Cell/B-Cell + GEx
- Cell cluster identification/annotation
- HLA typing for 5' GEx
- Bulk RNA sequence analysis including:
- Fusion analysis
- Differential expression
- Alternative transcript expression
- Sample QC evaluation and troubleshooting
- Customized analyses based on your project-specific needs
- Specialized analysis methods for:
- PDX models
- Cell-free DNA
- Viral DNA detection in tumor samples
We also develop new tools and strategies in a research setting that are then translated to the clinic. Our latest developments include BreaKmer for detection of structural rearrangements and RobustCNV for detecting changes in gene copies. In addition, the team is developing methods to analyze samples derived from PDX models, cell-free DNA, and single-cell sequencing.
In concert with developing new and updated offerings, the bioinformatics group has initiated the process of porting much of its analytics pipeline infrastructure to the cloud (currently Google's GCP) to speed data processing throughput and accommodate third-parties and collaborators that may primarily maintain an online cloud presence.
sc/sn Gene Expression (10X Genomics)
Overview
10x Genomics offers advanced single-cell and single-nuclei (sc/sn) workflows that enable detailed analysis of individual cells to unravel complex biological systems. Utilizing barcoded gel beads and unique molecular identifiers (UMIs), the 10X platform can capture and barcode RNA from thousands of individual cells in parallel. This allows for precise quantification and profiling of gene expression on a cell-by-cell basis. The resulting data provides insights into cell heterogeneity, identifies rare cell types, and offers a higher-resolution understanding of biological processes compared to traditional bulk RNA sequencing.
*https://www.10xgenomics.com/support
Analysis
Using 10X Cell Ranger software, sc/sn RNA sequencing reads are demultiplexed and aligned to the relevant transcriptome (pre-built references for which are available from 10X) to create cell barcode x gene expression matrix tables, which can be used for downstream data analysis via such open-source sc/sn tools as Seurat (https://satijalab.org/seurat/) or Scanpy (https://scanpy.readthedocs.io/en/stable/). Cell Ranger also outputs this sc/sn gene expression data in a proprietary loupe file format, which can be explored via the 10X Loupe Browser (https://support.10xgenomics.com/single-cell-gene-expression/software/downloads/latest#loupe).
Upon request, CCG Bioinformatics is able to provide a comprehensive array of data analyses, including quality control, differential expression, cell annotation, HLA typing ….and more.
*https://support.10xgenomics.com/single-cell-gene-expression/software/pipelines/latest/what-is-cell-ranger
scATAC (10X Genomics)
Overview
In addition to sc/sn RNaseq, 10x Genomics has also developed a single-cell ATACseq (Assay for Transposase-Accessible Chromatin) workflow. Unlike traditional bulk ATACseq methods, which provide an average view of chromatin accessibility across many cells, the 10x single-cell ATACseq technique deciphers the regulatory landscape of each cell. This is achieved by utilizing a combination of a transposase, which inserts sequencing adaptors into open chromatin regions, and unique gel bead barcodes to tag the DNA of individual cells. After sequencing, the data is demultiplexed using these barcodes, ensuring accurate attribution of chromatin accessibility data to each originating cell. This technology is a powerful tool to dissect the complexities of development, tissue heterogeneity, and disease progression at an unprecedented cellular resolution.
Analysis
Similar to sc/sn gene expression analysis, 10X Cell Ranger can be used to demultiplex and align scATAC sequencing reads to the relevant genome reference. ATAC peaks called de novo or from previously curated datasets can then be used to generate sparse cell barcode x peak read density matrices. A popular option for further downstream analysis of the scATAC data is the open-source software Signac (https://stuartlab.org/signac/). Of course, CCG Bioinformatics can work with laboratories to provide bespoke data analysis solutions based on specific project goals.

